

Measuring LinkedIn outreach success in B2B requires a comprehensive approach focusing on key performance indicators (KPIs) that truly reflect engagement quality and pipeline growth rather than mere activity volume. Incorporating quantitative metrics alongside qualitative insights and leveraging advanced tracking, attribution, and testing methods helps businesses optimize their outreach for sustainable sales outcomes.
What Are the Core Quantitative KPIs for Measuring LinkedIn Outreach Success?
Effective measurement starts with understanding and tracking several core KPIs. These include Connection Acceptance Rate, Reply Rate, Positive Sentiment Rate, Meeting Booking Rate, and Pipeline Revenue Generated. Each KPI offers unique insights into different stages of the outreach funnel, from initial engagement to closed deals.
- Connection Acceptance Rate: This metric calculates the percentage of sent connection invites that are accepted, indicating initial interest. Formula: (Accepted Connections ÷ Sent Connection Invites) × 100.
- Reply Rate: The percentage of sent messages that receive replies, reflecting engagement quality. Formula: (Replies Received ÷ Messages Sent) × 100.
- Positive Sentiment Rate: Analyzing replies to determine the proportion that express positive interest, openness to discussion, or enthusiasm. This qualitative KPI can be assessed using natural language processing tools or manual review.
- Meeting Booking Rate: The share of replies that convert into scheduled meetings, measuring effectiveness of conversations in advancing prospects. Formula: (Meetings Booked ÷ Replies Received) × 100.
- Pipeline Revenue Generated: Tracks the actual sales revenue attributed to leads generated from LinkedIn outreach campaigns, tying the entire funnel to business outcomes.
How Should Attribution Models Be Applied in LinkedIn Outreach?
Attribution models assign credit for conversions and revenue to touchpoints within a sales cycle, guiding accurate measurement of LinkedIn’s contribution. In B2B outreach, multi-touch attribution models are most effective because prospects often engage multiple times across different channels before closing.
Common models include:
- First-Touch Attribution: Credits LinkedIn outreach as the initial source introducing the prospect.
- Last-Touch Attribution: Attributes credit to the last interaction before conversion, which may be LinkedIn or another channel.
- Multi-Touch Attribution: Distributes credit across all relevant touchpoints proportionally, providing a holistic view of outreach effectiveness.
Combining LinkedIn outreach metrics with CRM data and integrating with email and paid campaigns enables accurate tracking and reporting on revenue impact.
What KPIs and Benchmarks Should Be Tracked in a Comprehensive Dashboard?
Building a real-time dashboard that compiles all relevant KPIs simplifies monitoring and aids swift decision-making. Below is a detailed KPI Benchmark and Metrics Matrix to guide goal setting and performance evaluation:
How Does Personalization Influence LinkedIn Outreach Metrics and Success?
Personalization is a key driver in enhancing engagement and conversion rates on LinkedIn. Implementing personalized connection requests and tailor-made messages markedly improves acceptance and reply rates. For example, connection requests that include a personalized note can boost acceptance rates up to 55%, while AI-optimized messaging tailored to prospect profiles can increase reply rates by approximately 40%.
Sales teams using customized sequences versus generic templates report not only higher quantitative metrics but also better qualitative responses. Personalization fosters trust and relevance, which are critical in B2B decision-making processes.
What Are Safe Limits on LinkedIn Invite Volumes to Maintain Account Health?
Maintaining LinkedIn account health is paramount to sustaining outreach efforts. It is recommended to send fewer than 80 connection invites per day to avoid triggering LinkedIn restrictions such as account suspension or throttling.
Alongside managing volume, closely monitoring acceptance and reply rates daily ensures that outreach remains productive and within recommended activity thresholds. Adhering to these limits helps preserve account credibility and steady network growth over time.
Why Should Pipeline and Buyer Intent Metrics Be Prioritized Over Simple Message Volume?
Focusing on pipeline and buyer intent metrics provides a more accurate picture of LinkedIn outreach effectiveness. The value generated in the sales pipeline and signals of buyer interest correlate more closely with revenue outcomes than raw counts of messages sent.
LinkedIn leads have been found to deliver up to 277% better results than leads from other social platforms, emphasizing the importance of prioritizing quality engagement. Integrating LinkedIn outreach with email and paid media campaigns can increase purchase rates by as much as 287%, turning outreach into an impactful multi-channel sales asset.

Which Buyer Intent Signals Should Be Tracked to Maximize LinkedIn Outreach Effectiveness?
Tracking real-time buyer intent signals allows sales teams to prioritize outreach timing and messaging to increase relevance and engagement. Key intent indicators include:
- Departmental growth or new team formations
- Leadership or organizational changes such as new hires or promotions
- Launches of new products or services
- Funding announcements or venture capital investments
Measuring pipeline value and reply rates associated with these signals helps optimize outreach efforts. Additionally, assessing multi-channel conversion rate lifts, including LinkedIn and email, contributes to a more holistic understanding of campaign performance.
How Can Teams Utilize A/B Testing and Cohort Retention for Continuous Improvement?
A/B testing, also known as split testing, is critical for refining message templates, subject lines, and outreach sequences. By sending two variations of messages to similar prospect segments and comparing key KPIs such as reply rates or meeting bookings, teams can identify what resonates best.
Cohort retention analysis tracks how different groups of prospects respond over time to outreach efforts, measuring sustained engagement and conversion rates. This longer-term view helps determine the effectiveness of messaging strategies and cadence, enabling adjustments that enhance overall funnel efficiency.
What Tools and Dashboards Can Support Efficient LinkedIn Outreach Tracking?
Automation tools like Linkautomy and LinkedIn’s Sales Navigator offer features to capture outreach data in real time, reducing manual logging and administrative burden. These tools often provide customizable dashboards showing trends in acceptance, replies, meetings booked, and pipeline progression.
Dashboards enable lean sales teams to focus on actionable insights rather than raw activities. Visualizing campaign performance facilitates data-driven adjustments, improving targeting, personalization, and follow-up timings.
Which Metrics Should Lean Sales Teams Monitor Regularly?
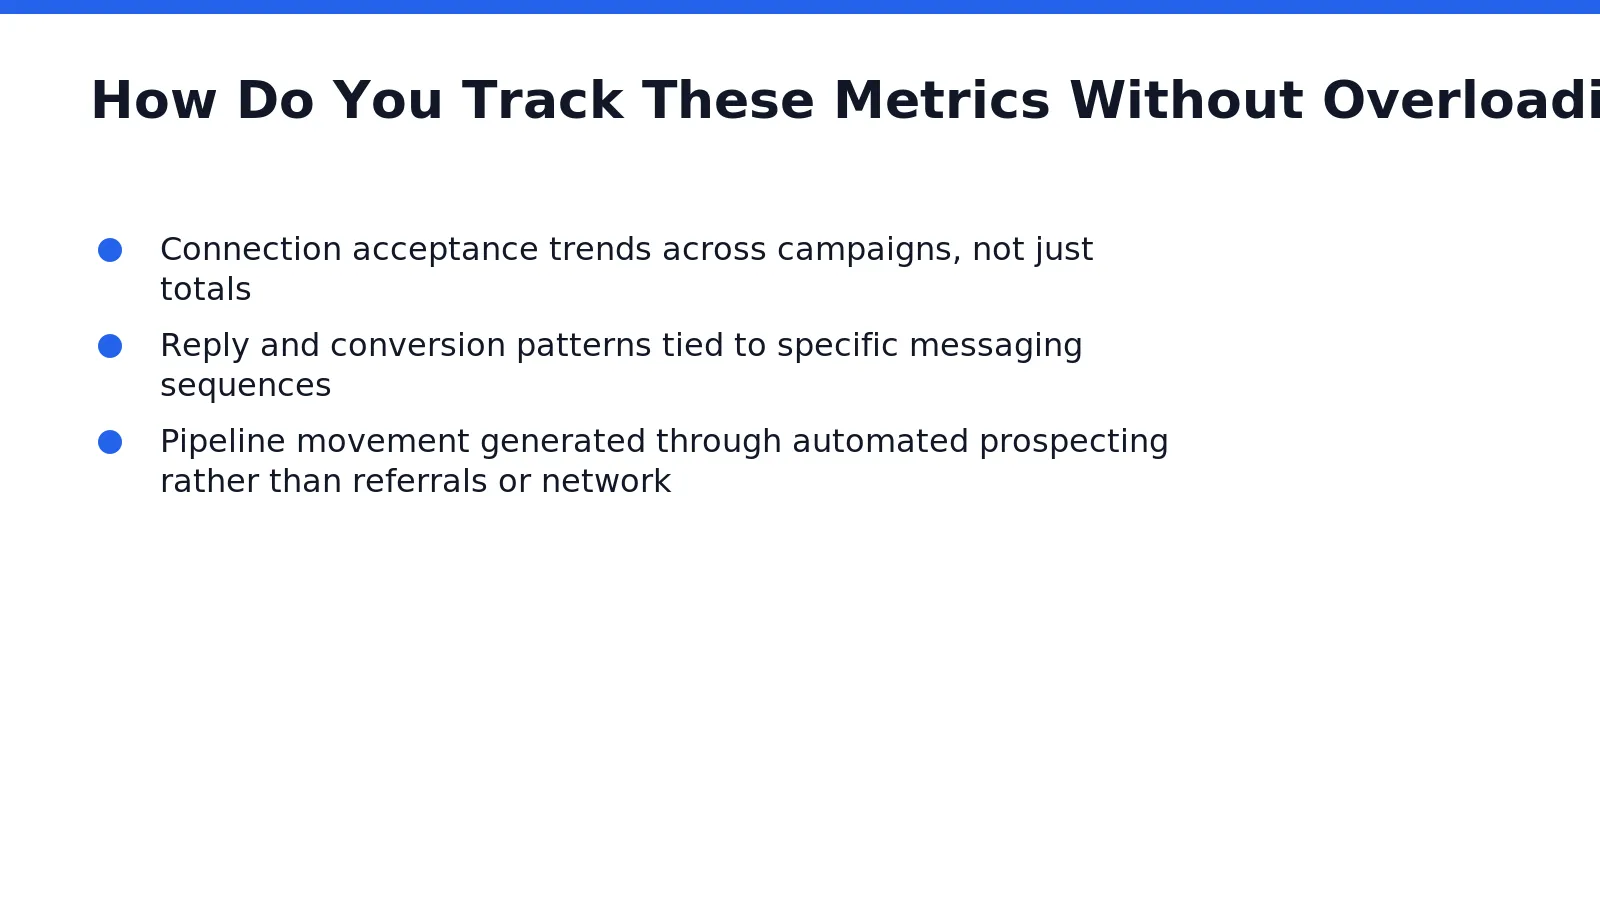
Lean teams should prioritize trend analysis over cumulative numbers for sustained success. Important metrics to track consistently include:
- Connection acceptance rate trends segmented by campaign or message type
- Reply and conversion rates correlated to specific messaging sequences or personalization methods
- Pipeline progression metrics driven by automated prospecting efforts and subsequent interactions
Focusing on these trends helps establish repeatable outreach processes, reducing dependency on inconsistent referral or networking channels.
Conclusion: How to Measure LinkedIn Outreach Success for Sustainable B2B Growth
Accurately measuring LinkedIn outreach success demands a multi-faceted approach. By tracking connection acceptance, reply rates, positive sentiment, meeting bookings, and pipeline revenue generated, sales leaders gain comprehensive insights. Applying attribution models, leveraging A/B testing, and analyzing cohort retention further refine outreach tactics.
Employing personalization, adhering to safe invite volume limits and monitoring real-time buyer intent signals elevate engagement quality. Automation and dashboards streamline data capture, empowering lean teams to focus on meaningful outcomes.
Implementing these frameworks and benchmarks transforms LinkedIn from an unpredictable channel into a predictable volume-driven revenue engine, enabling sustainable B2B growth.